 Blog Home
Dirty Data or Biased Data? Ethical AI Basics for Non Data Scientists

San Francisco

Published: October 15, 2018
All of us in tech are in a privileged position. We are creating and implementing technology that impacts not just our users or customers, but also society as a whole. I grew up in rural Georgia to a single mother of two who had to work two jobs to make ends meet. Each day, I represent the people that are not in the room with us when we create and implement the technology that impacts them. This is what drives me as the Architect of Ethical AI Practice at Salesforce.
This post is designed for people that are responsible for implementing AI systems but are not data scientists and do not have a background in statistics or probability. The intention is to create an approachable introduction to the most important concepts with regards to identifying potential bias (error) but this is no way intended to replace actual courses on data science or statistics. Perhaps you will find this as fascinating as I do and decide to learn more!
AI: A Dual-Use Technology
It is amazing to see all of the applications of artificial intelligence (AI) making a positive impact on the world, from detecting lead in pipes in Flint, Michigan to identifying the main drivers of deforestation and predict forest loss in the DRC.
However, AI is a dual use technology and with the good comes the bad. Make no mistake: AI is not neutral. It is a mirror that reflects back to us the bias that already exists in our society. Until we remove bias from society, we must take active measures to remove it from the data that feeds and trains AI every day. If you haven’t already, I recommend pausing for a few minutes and reading my previous posts, “How to build ethics into AI — part 1 and part 2.”
“Hope is the belief that our tomorrows can be better than our todays. Hope is not magic; hope is work.” —DeRay McKesson, author of “On the Other Side of Freedom: The Case for Hope”
Working to Mitigate Bias
We can’t hope that we are implementing unbiased technology; we must work to identify and remove bias. If you’re not a data scientist, it can be intimidating to understand many of the statistical concepts related to AI and bias, like “collinearity” and “data leakage,” but I’m here to introduce some concepts that should make all of this a little less daunting. If you are using Salesforce Einstein, many potential sources of biases and data quality issues will be flagged for you, but you should still understand the concepts behind the recommendations.
Biased or Fair?
When we talk about AI, we have to talk in terms of probability and statistics. No AI can be 100% correct in its predictions. As a result, there will always be some amount of error. Error is the difference between an estimator’s expected value vs. its true value. So when we talk about “bias” in AI, we actually mean error.
Since there will always be some amount of error, AI administrators must decide how to handle that error. One way of asking that is, “How much risk are they willing to accept based on the amount of error in the prediction?”
From this question usually comes the question of what it means to be “fair”? Fairness is usually defined as a decision made free of self-interest, prejudice, or favoritism. But fairness is in the eye of the beholder. What seems fair to me may seem extremely unfair to you.
Let’s use an example of a bank trying to decide whether an applicant should be approved for a car loan. An AI system can make a risk assessment and recommend whether an applicant should be approved or rejected. Remember that the AI can never be perfect so there is always a chance that the AI will make the wrong prediction.
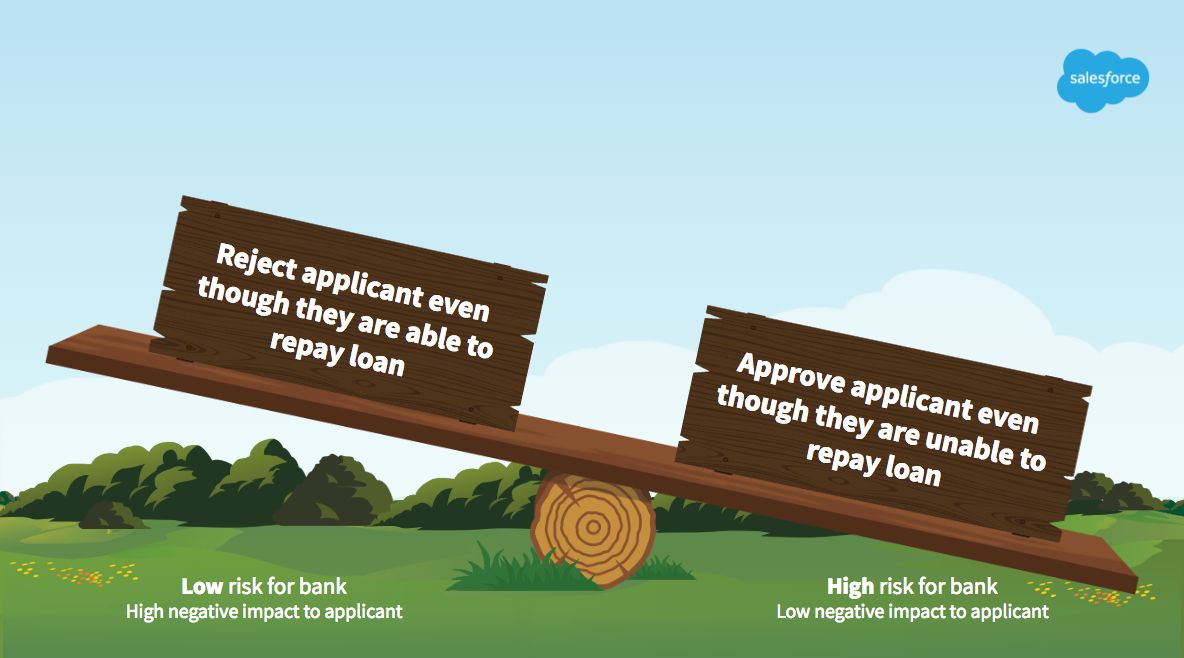
An AI may incorrectly predict that an applicant cannot repay a loan when actuality, he or she can. It could also predict that an applicant can repay a loan when in actuality, he or she cannot. As the AI administrator, you have to decide what your comfort level is for each type of error. The risk of harm here will either be greater for the bank or the applicant. Most companies feel a responsibility to minimize the risk of financial loss. However, companies also have a responsibility to ensure the data and algorithms they use are making decision based an applicant’s merits and not on systematic bias that runs through our society.
Minimizing Harm by Maximizing Data Quality
When making decisions like this, it is important to understand the impact of the decision. Are some individuals or groups disproportionately impacted? Are they not as likely to receive a fair or impartial assessment due to inaccuracies in the data or systemic bias in historical decision making? To determine that, you must look at the data your system is using to make its recommendations.
Error in AI often results from bad or dirty data. So dirty data = biased data.But how do you know if your data are biased? According to a Harvard Business Review study in 2017, only 3% of companies are making decisions based on data that meets basic quality standards. Do you think your organization is part of the 97% or 3%? A more recent article predicted that most companies attempting to implement AI will fail and one of the primary reasons is lack of enough clean training data.
I am going to share a few ways that you can look at your data and understand if there are problems that could result in error or bias.
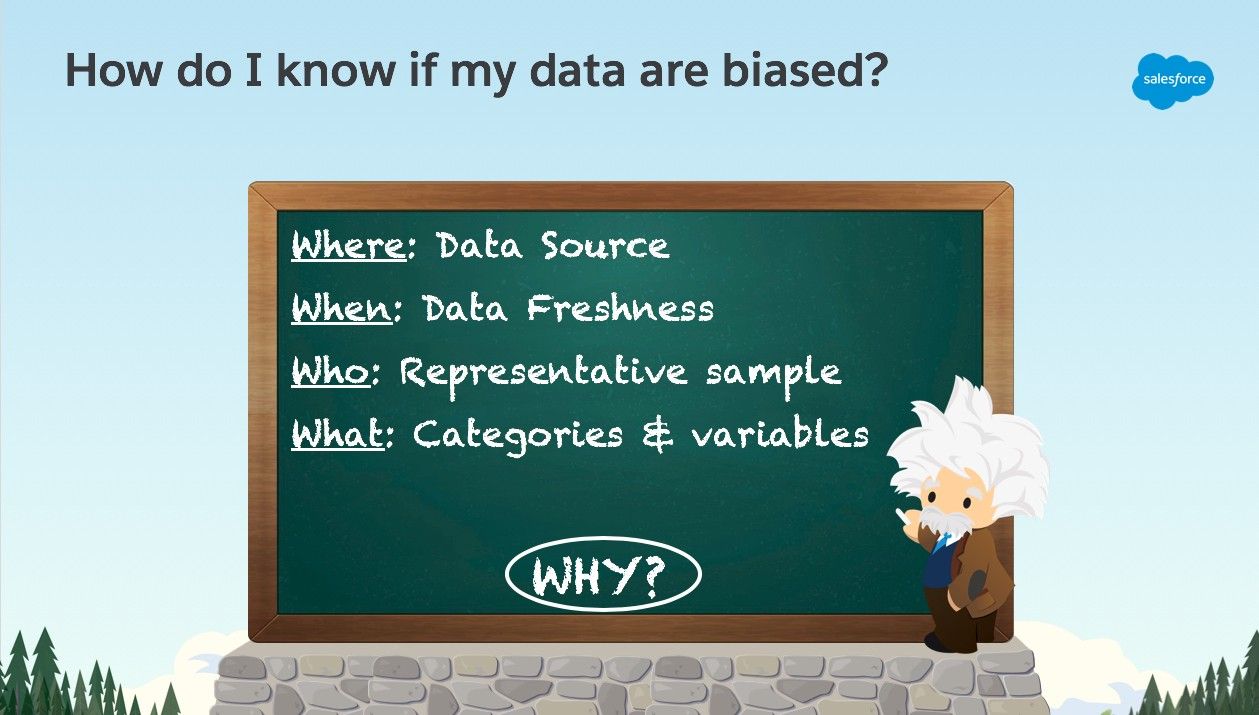
The 5 W’s of Data Quality and Accuracy
There are several ways you can look at your data to determine if it is biased. You can think about in terms of the 5 W’s: Where, When, Who, What, and for each of these questions, you have to ask, “WHY?” For example, “Why are the data days old rather than minutes or seconds old?” and “Why did we select this group of users to include in our data set?”
Einstein can help spot potential bias or data quality issues but ultimately, YOU know the context of your business and your data so you must be the ultimate decision maker.
WHERE are your data being sourced from?
You must begin by understanding the quality of the data you are making your decisions from. Is the source directly from your users/customers or is it being collected from a third party? Are you using the raw data in your model or is it being filtered first? If it is being filtered, who created the filters and why? Is the data categorized or labeled (i.e., has someone tagged the data)? If so, who is doing it? Is the team sufficiently diverse? Are the categories or labels accurate and complete?
For example, in many customer support centers, the default priority for a new support case is “medium” until a service agent reviews the case and determines if the priority needs to be changed. The final assigned priority is typically used in reporting to help companies see trends in the severity of their issues. If agents aren’t actually updating that field, when the AI system predicts case priority, it will “learn” to mark every case as “medium.” The result is that reports will erroneously show a sudden drop in the severity of cases. Systemic bias and inaccuracies can enter your data set from the very beginning and need to be removed.
WHEN are your data coming in (i.e., freshness)?
How fresh, or recent, is your data? Making decisions based on data that are days or even hours old can have a serious negative impact on the accuracy of any prediction or recommendation.
Let’s imagine that a company manufactures and supports complex industrial machinery and uses AI to predict when a machine needs maintenance. If the data the AI is using is days or even hours old, it may not predict and warn about maintenance needs until it is too late and the machine has already failed.
Can you increase efficiencies in the system to improve the freshness? This might mean upgrading your systems or decreasing the number of integration points between systems.
WHO are you getting data from or about?
You need to know if the data you are using in your models are representative of ALL of your customers or users. Are you using data from a subset of all of your users or from a certain type of user? Are you getting data from a lot more of one group than another? If so, your distribution is going to be skewed or unbalanced. For example, if you are collecting data for Einstein for Service and you do not offer customer support for your free users, that means you are probably missing data for all of those individuals and your predictions will be valid only for your paying customers.
Are you getting the same information for all of your users? If not, you will see null values or zeroes for some fields. This is a signal that your data are not representative of your users or customers.
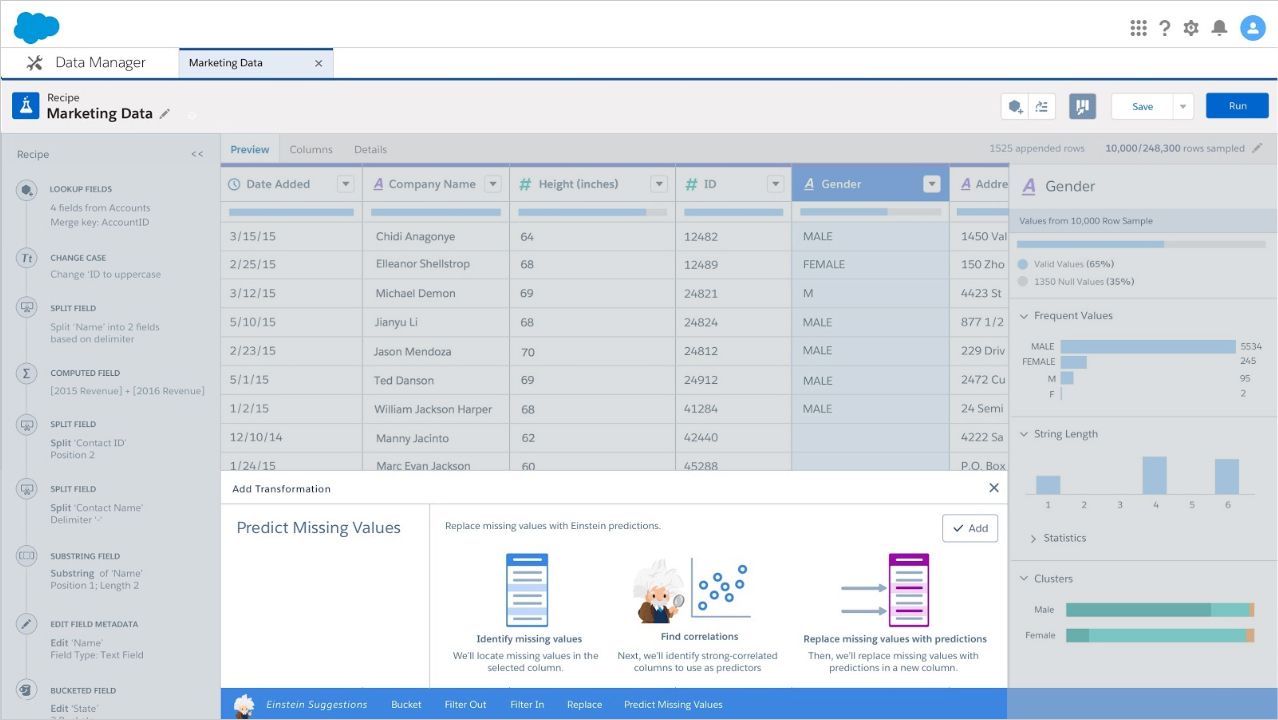
Below is an example from Einstein Analytics Data Manager with data from a fake Pharmaceutical company.
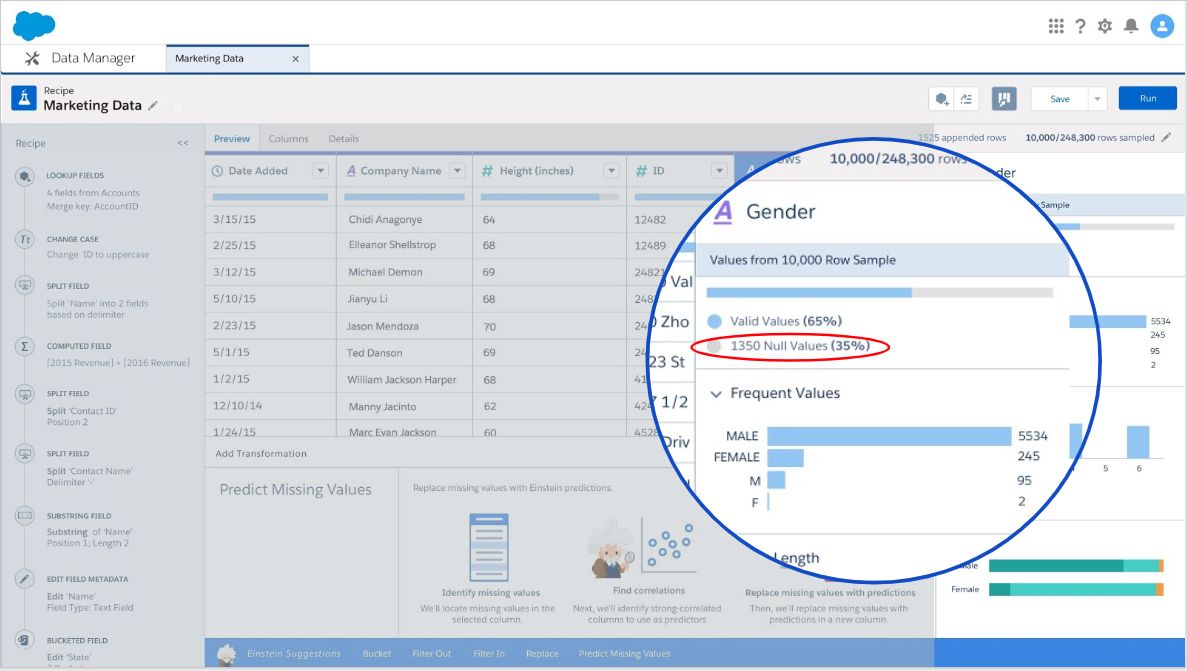
We can see we have WAY more males represented than females. If you are marketing an asthma drug that could equally apply to men and women, this kind of skew should give you real concern. You either need to collect more data to even out the distribution or decide how to handle it statistically. For example, you might randomly sample a subset of data from the larger or group or you might weight the data to enhance the smaller subset.
You can also see that 35% of your data set contains null values. That’s quite a lot. In the screenshot below, we see Einstein offering to help you out by predicting your missing values.
The final thing to look at when understanding the representativeness of your data is whether or not you have outliers. An outlier is a data point that lies an abnormal distance from the other values in the data set.
In the screenshot below, we can see Einstein has identified outliers in five categories and recommends removing them. An important question to ask is, “When should I remove outliers?” You’ll want to look at your data to better understand why those outliers exist and what they mean. A typical reason is that they are the result of incorrectly entered or measured data. Not only will you want to remove those outliers, you will want to understand what caused them to be entered or measured incorrectly so you can fix it.

WHAT categories are being collected and used?
There are three kinds of data categories, or variables, to be aware of and potentially remove from your data because they can introduce bias, or error: special data categories, proxy variables, and data leakage.
Special data categories
You may also hear this referred to as “protected classes of data” or “prohibited categories.” These are categories of data that you may not consider in certain decision making such as hiring or housing eligibility. These include:
- Race, ethnicity, or country of origin
- Gender
- Age
- Sexual orientation
- Religious or political affiliation
If any of these categories of data are used to train a model, you may be making a biased decision. Or you may not.
Let’s look back at our asthma example with far more females than males. If the same pharmaceutical company manufacturing the asthma drug were instead manufacturing a prostate cancer drug, something applicable only to males, then using gender is not biased. Remember: bias means error. In this case, you want to market the drug to men so using gender in your predictions makes sense.

Again, if it’s a drug for prostate cancer, having women in your data set is something you might want to dig into further. Is this a labeling error? Or are these transgender individuals who identify as female but are biologically male?
Proxy variables
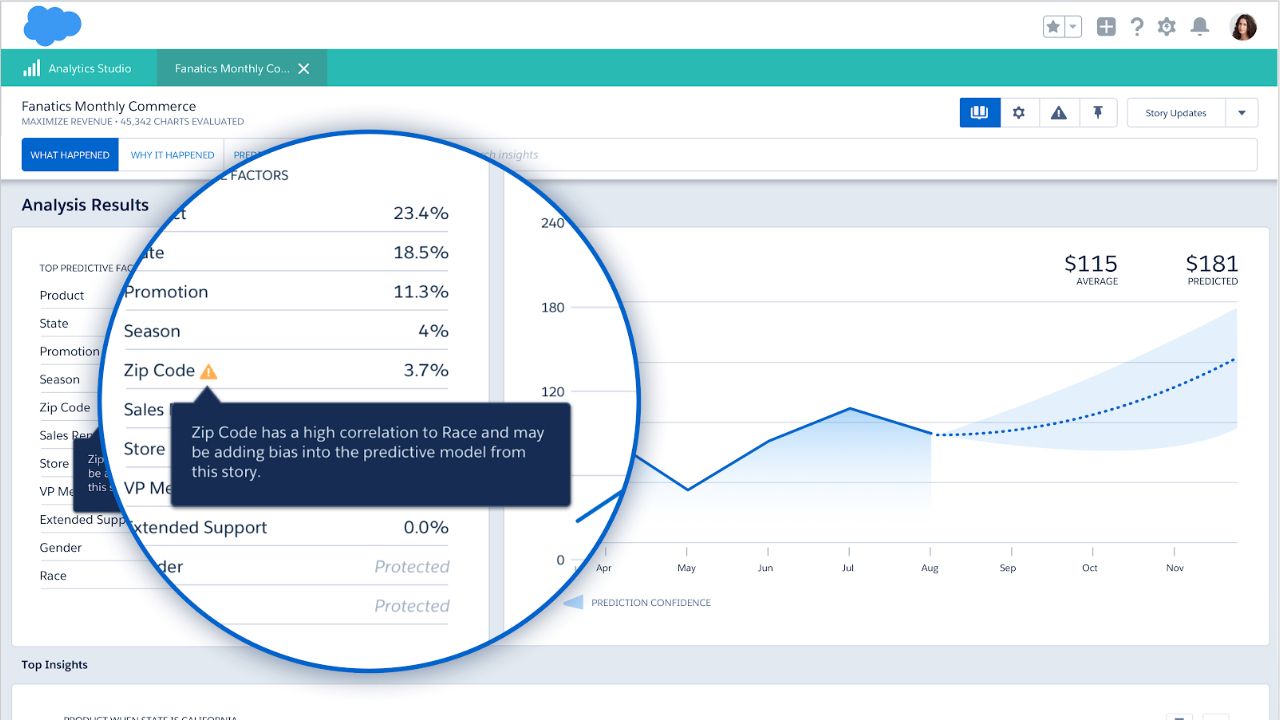
A “proxy variable” is a variable that is not directly relevant by itself, but serves in place of another variable. Even if you are not using a special data category in your predictions, you might be using other variables that are a proxy for it. For example, because of a historical practice redlining in the US, zip code + income = race. That means even if you are not making predictions using the explicit “race” variable, if you are using zip code and income, the predictions will be influenced by race. Below you can see Einstein Analytics calling out this potential proxy in the data.
Data Leakage
Also known as “hindsight bias,” data leakage results from using variables in your prediction model that are known only after the act of interest. The definition can be confusing, so let’s look at an example. Let’s imagine that you are selling outdoor gear. You want to know if it is going to rain so you can increase the marketing of your rainy weather gear.
One observation you might have captured historically is whether or not someone has used an umbrella. In the graph below we see a strong correlation between rainy weather and umbrella use. This is referred to as “co-linearity.” Since umbrella use comes AFTER the thing you want to predict (rain), you should not use it in your predictive model. Data leakage variables can be so strong that they can overwhelm the entire model so you will want to remove them.

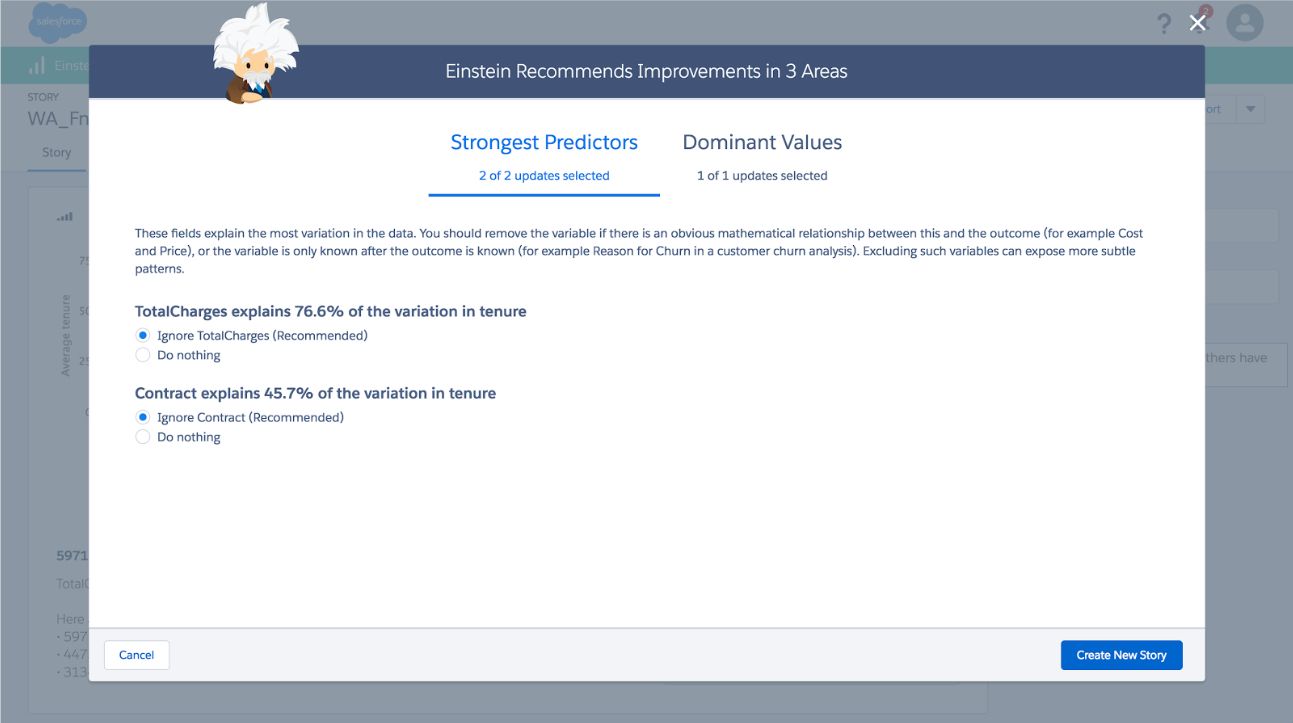
Below is what you might see in Einstein Discovery if data leakage is detected. It is highlighting the strongest predictors and warning you that these could be the result of data leakage. Since you know the context of your data, you need to make this determination yourself and decide whether or not to include them.
“AI models hold a mirror up to us; they don’t understand when we really don’t want honesty. They will only tell us polite fictions if we tell them how to lie to us ahead of time.” —Yonatan Zunger, Distinguished Engineer on Privacy at Google
AI is powerful, and with great power comes great responsibility. Until our society of free of bias, we must meticulously manage our data to remove it.
Thank you Richa Prajapati, Greg Bennett, Joe Veltkamp, Steve Fadden, Raymon Sutedjo-The, and Steven Tiell for all of your feedback!