 Blog Home
Benchmarking Triton (TensorRT) Inference Server for Transformer Models
Summary
We investigate NVIDIA's Triton (TensorRT) Inference Server as a way of hosting Transformer Language Models. The blog is roughly divided into two parts: (i) instructions for setting up your own inference server, and (ii) benchmarking experiments. The instructions are intended to be detailed and standalone, but readers interested solely in benchmarks are encouraged to jump to the respective section.
The key takeaways of our benchmarking experiments are:
- A single V100 GPU can provide ~600 queries per second (QPS) at high concurrency, and a latency of ~5 ms at low concurrency for a BERT-Base model.
- Dynamic batching, i.e., server-side batching of incoming queries, significantly improves both throughput and latency.
- Performance is positively impacted by reducing input sequence length. Hence, padding to a fixed maximum length should be avoided if possible.
- Static batching, i.e., client-side batching, does not significantly improve throughput or latency when dynamic batching is employed. This obviates the need for explicit batching outside of the inference server.
- Serving multiple models on the same server instance leads to throughput being reduced by an amount proportional to the number of models hosted. The composite throughput, however, is not impacted sufficiently.
- Under our experimental setup, TensorFlow performs better than PyTorch in both throughput and latency across various model types. These performance gains diminish as model size and/or batch size grows.
Introduction
The Serving Problem
Let us begin by discussing what the serving problem is and establish a common vocabulary. For the purpose of this blog post, we will primarily focus on Transformer Language Models for text classification. Serving such a model essentially equates to providing an endpoint that is efficient and secure. The lifecycle of model serving typically involves multiple personas: scientist(s) will train the model on available data and engineer(s) will assist in the integration of the solution into the model repository while emphasizing maintainability, efficiency, security, and reusability. Stereotypically, but not always, there is a disconnect between how these two groups function. Scientists often use bleeding-edge technology in their attempts to squeeze performance which may jeopardize aspects important to engineers such as maintainability. On the other hand, engineering requirements can often seem cumbersome to scientists who are trying to solve novel problems with uncertain exploration landscapes. Consider, for instance, a serving solution that relies on TensorFlow, e.g., TFServing. This choice either forces model exploration to fit well in the TensorFlow paradigm, or requires an (often expensive) code translation from another framework after an acceptable model has been found. Finding a solution that satisfies both scientists and engineers is the heart of the serving problem we wish to investigate.
Summarily, an ideal solution is one that allows for efficient and maintainable serving without severely restricting scientists.
Available Solutions
Given that serving is such a central problem, it should come as no surprise that there are several existing solutions, each with their pros and cons. A detailed commentary on each of them is beyond the scope of this blog, but some of the popular approaches include TensorRT Serving (the subject of this blog post), Caffe2, TFServing, Flask, BentoML, and Clipper. It is also possible to serve models directly in C++ once they have been exported from a higher-level framework. Cloud providers such as AWS and GCP also have their own serving solutions.
NVIDIA Triton (TensorRT) Inference Server
Two things attracted us to NVIDIA's Triton (TensorRT) Inference Server offering: (i) it is possible to host models from different frameworks (ONNX, PyTorch and TensorFlow inclusive) with a lot of flexibility and additional features like model versioning and dynamic batching, and (ii) the benchmarks from NVIDIA demonstrating a tight symbiosis between the software and hardware stack. A detailed explanation on its architecture is beyond the scope of this blog, so we refer an interested reader to the architecture documentation and this great set of slides.
Inspired by NVIDIA's excellent benchmarks on BERT, we extend the investigation to include: (a) standalone and detailed instructions on setting up an inference server, (b) benchmarks on other Transformer Language models (ALBERT, GPT2 and CTRL), and (c) benchmarks on hosting multiple models on the same server.
For very good reasons, NVIDIA is renaming the TensorRT Inference Server to Triton Inference Server. Since this is still relatively a little known fact, we label this offering as the Triton (TensorRT) Inference Server to prevent confusion.
Experimental Setup
For the purpose of this investigation, we primarily focused on Transformer Language Models, viz., BERT, ALBERT, GPT2, and CTRL. This is by no means an exhaustive list; many other models exist in the same family. However, we hope that the results on the aforementioned models give enough insights about performance on those not included. In future blog posts, we will investigate other modalities such as image and speech.
For our benchmarking, we rely on the Transformers Python library of HuggingFace since it hosts all considered models with a clean interface and strong performance. We note that this choice doesn't impact the benchmarks much. A pure-PyTorch original version of RoBERTa or a pure-TensorFlow original version of BERT unsurprisingly yielded similar latencies and throughput as the HuggingFace version. We also refer an interested reader to the HuggingFace benchmarks for various models available in their repository.
Most of our experiments were performed with HuggingFace's implementation of BERT-Base on a binary classification problem with an input sequence length of 128 tokens and client-side batch size of 1. We include both PyTorch and TensorFlow results where possible, and include cross-model and cross-framework benchmarks at the end of this blog.
We used a machine with a single V100 GPU as the server and a high-CPU (96 vCPUs) machine as the client. We measured all latencies and throughputs server-side to obviate any network effects. Finally, we used NVIDIA's pre-built Docker containers for both client and server machines. Specifically, we used the latest versions at the time of writing, which were nvcr.io/nvidia/tensorrtserver:20.02-py3 for the server and nvcr.io/nvidia/tensorrtserver:20.02-py3-clientsdk for the client. Please refer to the NGC documentation for more details.
A Minimalistic Guide to Setting Up the Inference Server
Next, let's talk about how you can go about setting up your own Triton (TensorRT) Inference Server. The official documentation is a great resource to learn more about the offering, but we hope that this section present standalone and concrete instructions on getting started with minimal effort.
In general, there are three steps to setting up: (1) convert the model in a format (and within a directory structure) that the server can discover, (2) write a config.pbtxt model configuration file, and (3) instantiate the server with this configuration.
Step 1: Load and Convert the Model
For PyTorch models, this step involves converting the model into its JIT traced version, whereas for TensorFlow, it involves exporting the graph in the SavedModel format with tf.function and XLA enabled. For TensorFlow, simply using the SavedModel format is insufficient for obtaining optimal performance. To convert a HuggingFace model, use the following code snippet.
TensorFlow:
PyTorch:
Next, save the models in the following directory structure:
You can add as many models as you wish (or just one) to this model repository.
Step 2: Write The Configuration File
Next, we tackle the model configuration file, config.pbtxt. In Step 1, we exported the model for inference but the server doesn't know details such as the allowable input shapes, maximum/preferred batch sizes, optimizations, model priority, or versioning policy. We communicate these details, and more, through this configuration file.
A sample config file for a TensorFlow BERT model is as follows:
Note:
- The example above is for TensorFlow. For a PyTorch model, the configuration file is identical except that the platform flag is
pytorch_libtorchinstead oftensorflow_savedmodel. - Input dimension of
-1indicates that the shape will be specified only at runtime. For this to work, the model needs to be able to handle indefinite shapes. Output dimension is2since we are dealing with a binary classification problem. - We specify the model versioning policy via
version_policy: { latest { num_versions : 1 }}(query the latest version). - Dynamic batching instructs the server to wait a predefined amount of time (in our case, 30ms) and batch up all requests that occur in that window with a maximum of 64, while paying attention to our preferred sizes. A good practice is to keep this window large enough to fill the maximum batch size while ensuring that the latency stays bounded to an acceptable value.
- We also enable XLA acceleration via the level 1 optimization flag. We found XLA to perform better than TensorRT acceleration in our initial experiments.
Note that we have a config file for every model in our repository.
Step 3: Instantiate the Server
Now that we have our models and their respective configuration files, all we need to do is instantiate the server. This can be done simply by running:
trtserver --model-repository=<path_to_model_repository> --log-verbose=true
(BONUS) Step 4: Metrics and Monitoring
NVIDIA also provides a neat interface to metrics and monitoring without much effort. The available documentation is a bit sparse so we include details on how to get set up below.
By default, the inference server starts the metrics service at port 8002. While there may be ways to use information from the service directly, NVIDIA recommends using Prometheus (Installation instructions are available here).
First, we need to write a simple YAML file that connects the monitoring service to Prometheus.
Then, you can simply run ./prometheus --config.file="config.yaml" for Prometheus to start a metrics server at localhost:9090 (by default). You can get most of the monitored metrics you need here, but you can also take it one step further by connecting Prometheus to Grafana.
Optional: Grafana
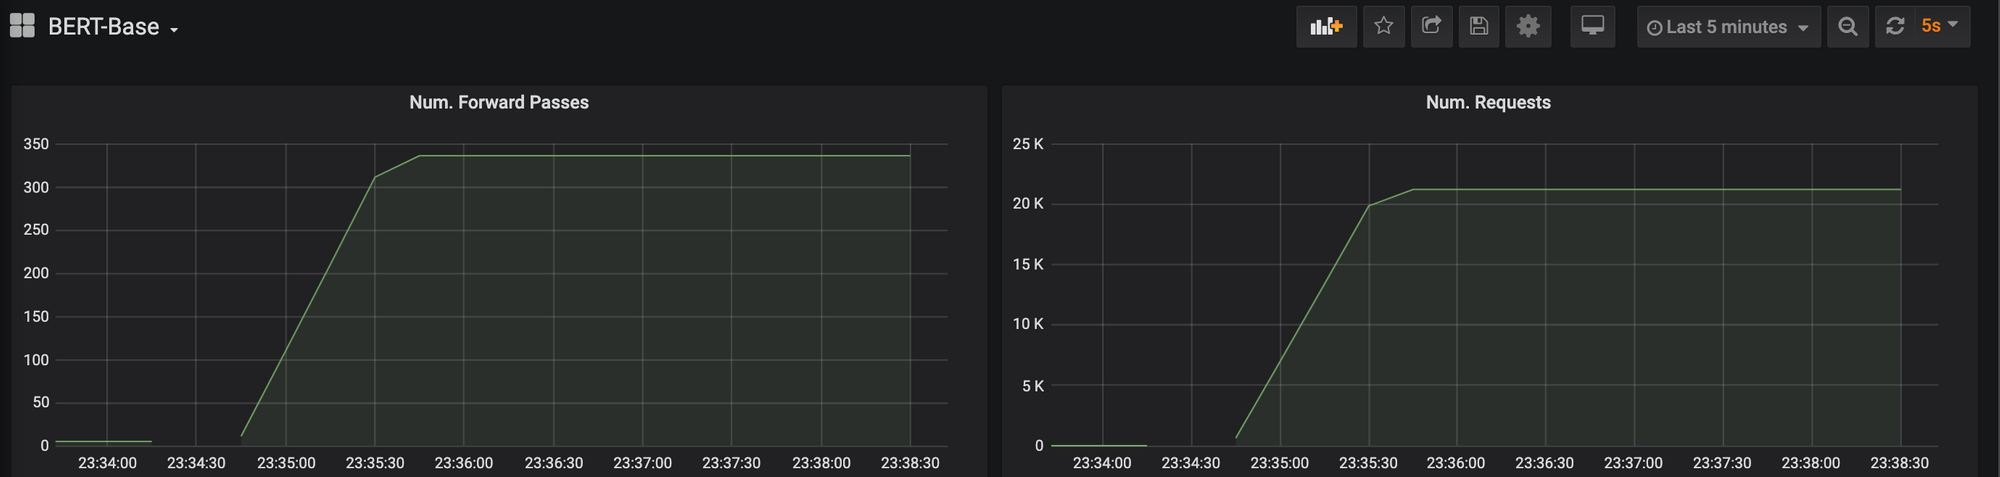
You can install Grafana here, start the service, and then go to localhost:3000 (by default) for the GUI. On the data import dashboard, add Prometheus on localhost:9090 as a data source. At that point, you can visualize any of the metrics captured by the inference server (or simple functions of those) in various ways such as graphs, numbers or dials.
Benchmarks
Now, let's get into the meat of the blog post: the benchmarks! Unless otherwise specified, all experiments were conducted with the BERT-Base model with the configurations discussed in the previous sections.
We define:
- concurrency to be the number of simultaneous requests to the server.
- latency to be the average time required by the server for processing a query.
- throughput to be the average number of queries processed by the server per second.
The latency is composed of three parts: (a) general overhead, (b) queue time, and (c) compute time. It does not include any pre- or post-processing times. The trajectory of the graphs did not change if used p95 or p99 latency instead.
For all benchmarks, we use the perf_client tool from NVIDIA (Refer to this for more information). We leave all settings to default except use a measurement window of 10000ms ( -p), and remove any latency limit (-l).
In most of our benchmarking plots below, we present results for both PyTorch (dotted line) and TensorFlow (solid line). We include a brief caveat regarding these results next, but defer a detailed discussion on their comparison to the end of this blog. Summarily, in our experiments, TensorFlow exhibits better performance than PyTorch. These results corroborate those obtained by others. Measured in terms of inference latency, TensorFlow is significantly better at lower batch sizes and modestly better at higher batch sizes. However, there are multiple ways to optimize performance for a specific framework (including tuning the model configuration file) which we have not investigated in detail. As such, please take these framework benchmarks with a truckload of salt. They are not intended to be prescriptive, but rather describe out-of-the-box performance without explicit optimization effort.
Latency with Concurrency

The graph shows a near-linear increase in latency with concurrency. With dynamic batching, it is possible to maintain a high throughput (see below) while under 200ms latency with 100 concurrent threads. Without dynamic batching, expectedly, the time in queue increases with concurrency while the overhead and compute time stays roughly constant. The latency for a single query is on par with those reported by other benchmarks operating directly in the higher-level framework (PyTorch/TensorFlow) without a server atop.
Throughput with Concurrency

With dynamic batching enabled, high concurrency results in high throughput, which peaks around 600 QPS (queries per second) for TensorFlow and around 500 QPS for PyTorch.
It is typically more informative to summarize the performance of the system with the latency-throughput graph (presented below). For the benchmarks to follow, we report this curve rather than the split graphs for easier readability. The non-monotonicity of this graph is primarily due to dynamic batching effects; as concurrent threads match the preferred batch sizes chosen, it is easier to form batches and vice versa. This directly affects model performance.

Latency and Throughput with Sequence Length

With Transformer Language Models, the length of the input has a significant impact on the performance of the model. The cost of self-attention, the basic ingredient of Transformer models, grows quadratically with sequence length. In the figure above, we observe (unsurprisingly) that for both latency and throughput, a lower sequence length translates into lower latency and higher throughput, and vice versa. In practice, a popular way of dealing with sequences of different lengths is to choose a maximum length and pad all inputs to it. The graphs above indicate that doing so leaves latency and throughput gains on the table, and as such, dynamic sequence lengths should be preferred, if possible.
Latency and Throughput with Static Batch Size

When each query to the server is already in the form of a mini-batch, it enables higher throughputs at lower concurrency values. This is primarily because the samples do not spend as much time in queue waiting to be batched. The figure above shows the performance of the server with varying levels of (static) batching. We define static batching as one where the batch is created client-side, as opposed to the dynamic batching performed by the server. The peak throughput, measured in terms of samples evaluated per second, is not as impacted by the (static) batch size. This is encouraging since any batching logic can be deferred to Triton (TensorRT) Server rather than an external service without significant loss in performance.
Latency and Throughput with Multiple Models

For this experiment, we host two separate BERT-Base models on a single server. They are both queried simultaneously. Because the server intelligently swaps models and allows for multi-stream execution, we see (somewhat surprisingly) that the peak composite throughput is on-par to that of a single model (~ 600 QPS). The throughput for each model, however, is reduced to a fraction corresponding to the number of concurrent models. We found that these results remain true even for up to 5 concurrent models.
Latency and Throughput for Different Models

We also show how models other than BERT perform in our benchmarks. To prevent crowding the graph, we include results only for TensorFlow. Given that most of the included models use the same operations (self-attention) but with a different number of parameters through deeper/wider networks, they have similar trajectories. For GPT2 and CTRL, we use the next-word-prediction model (rather than a binary classification model). BERT-Base, ALBERT-Base and GPT2-Small have similar configurations for the encoder (12 layers of self-attention), and hence perform comparably for both latency and throughput. Similar is the case for the three 24-layer models: BERT-Large, ALBERT-Large and GPT2-Medium; and the 48-layer models: GPT2-XL and CTRL (the lines overlap within the bounds of the graph). Amongst the pair of billion-scale language models, CTRL had a peak throughput of ~35 QPS, while GPT2-XL peaked at 32 QPS.
PyTorch versus TensorFlow

Finally, we comment on the comparison between PyTorch and TensorFlow. In the graph above, we include comparisons between PyTorch and TensorFlow between a few other models, viz., GPT2-Small, BERT-Large and CTRL. As we described in our experimental setup section, this comparison is not without caveats. There are several ways to tune performance of each to minimize the gap. However, without further optimizations, the results mirror benchmarks comparing the two frameworks outside of TensorRT (Triton) Inference Server. TensorFlow tends to perform better on lower batch sizes and relatively smaller models with gains diminishing as model size and/or batch size grows.
Given the tight interoperability of TensorFlow and PyTorch in the HuggingFace codebase, it is possible also to train a model in one framework and serve in another. Hence, in this context, the choice of the training framework matters less.
Conclusion
There are many aspects of serving that we did not discuss as a part of this blog. We didn't compare against a different serving platform (such as TFServing or Flask). This exclusion was for two reasons: (i) our goal was to investigate how close we could get to the (highly optimized) benchmarks from NVIDIA for serving while still retaining an easy bridge from research PyTorch/TensorFlow models to production; and (ii) neither of the solutions we considered (TFServing, Flask, and a few others) provided a comparable out-of-the-box alternative. Further, as we highlight in the benchmarks comparing PyTorch and TensorFlow, such comparisons often underscore the difficulty in optimizing performance rather than an inherent inadequacy of the framework.
In the future, we plan on expanding our benchmarks to include computer vision models, such as classification, object detection and OCR models. We will also explore more production-necessary functionalities of Triton (TensorRT) Inference Server, including model versioning and priorities, and discuss issues pertaining to model serving beyond the inference server such as authentication, model swapping, load balancing, and pre-/post-processing.
Please reach out to us with any questions, or if there is something you'd be interested in discussing that we have not covered.
Acknowledgments
Special thanks to Shashank Harinath for the initial prototypes and continuous feedback on the benchmarks and the blog.
Thanks to Arpeet Kale, Caiming Xiong, Bryan McCann, Huan Wang, Wenhao Liu, and Richard Socher for their feedback on scoping and improving the blog post.
Thanks to Aadyot Bhatnagar, Ali Madani, Jean Marc Soumet, Jin Qu, Michael Jones, Sachin Ramachandran, and Tong Niu for feedback on the drafts of the blog post.
Thanks to Melvin Gruesbeck for assistance with visualizations and design recommendations.